
The GDQ report is an intuitive tool that provides deep insights into your group. The group members answer a questionnaire consisting of 60 questions, each based on extensive research. Once all the responses have been collected, an insightful and editable report unique to your group is generated automatically.
Below you can read examples of the various parts of the report and you can also read about its aims.


Theory
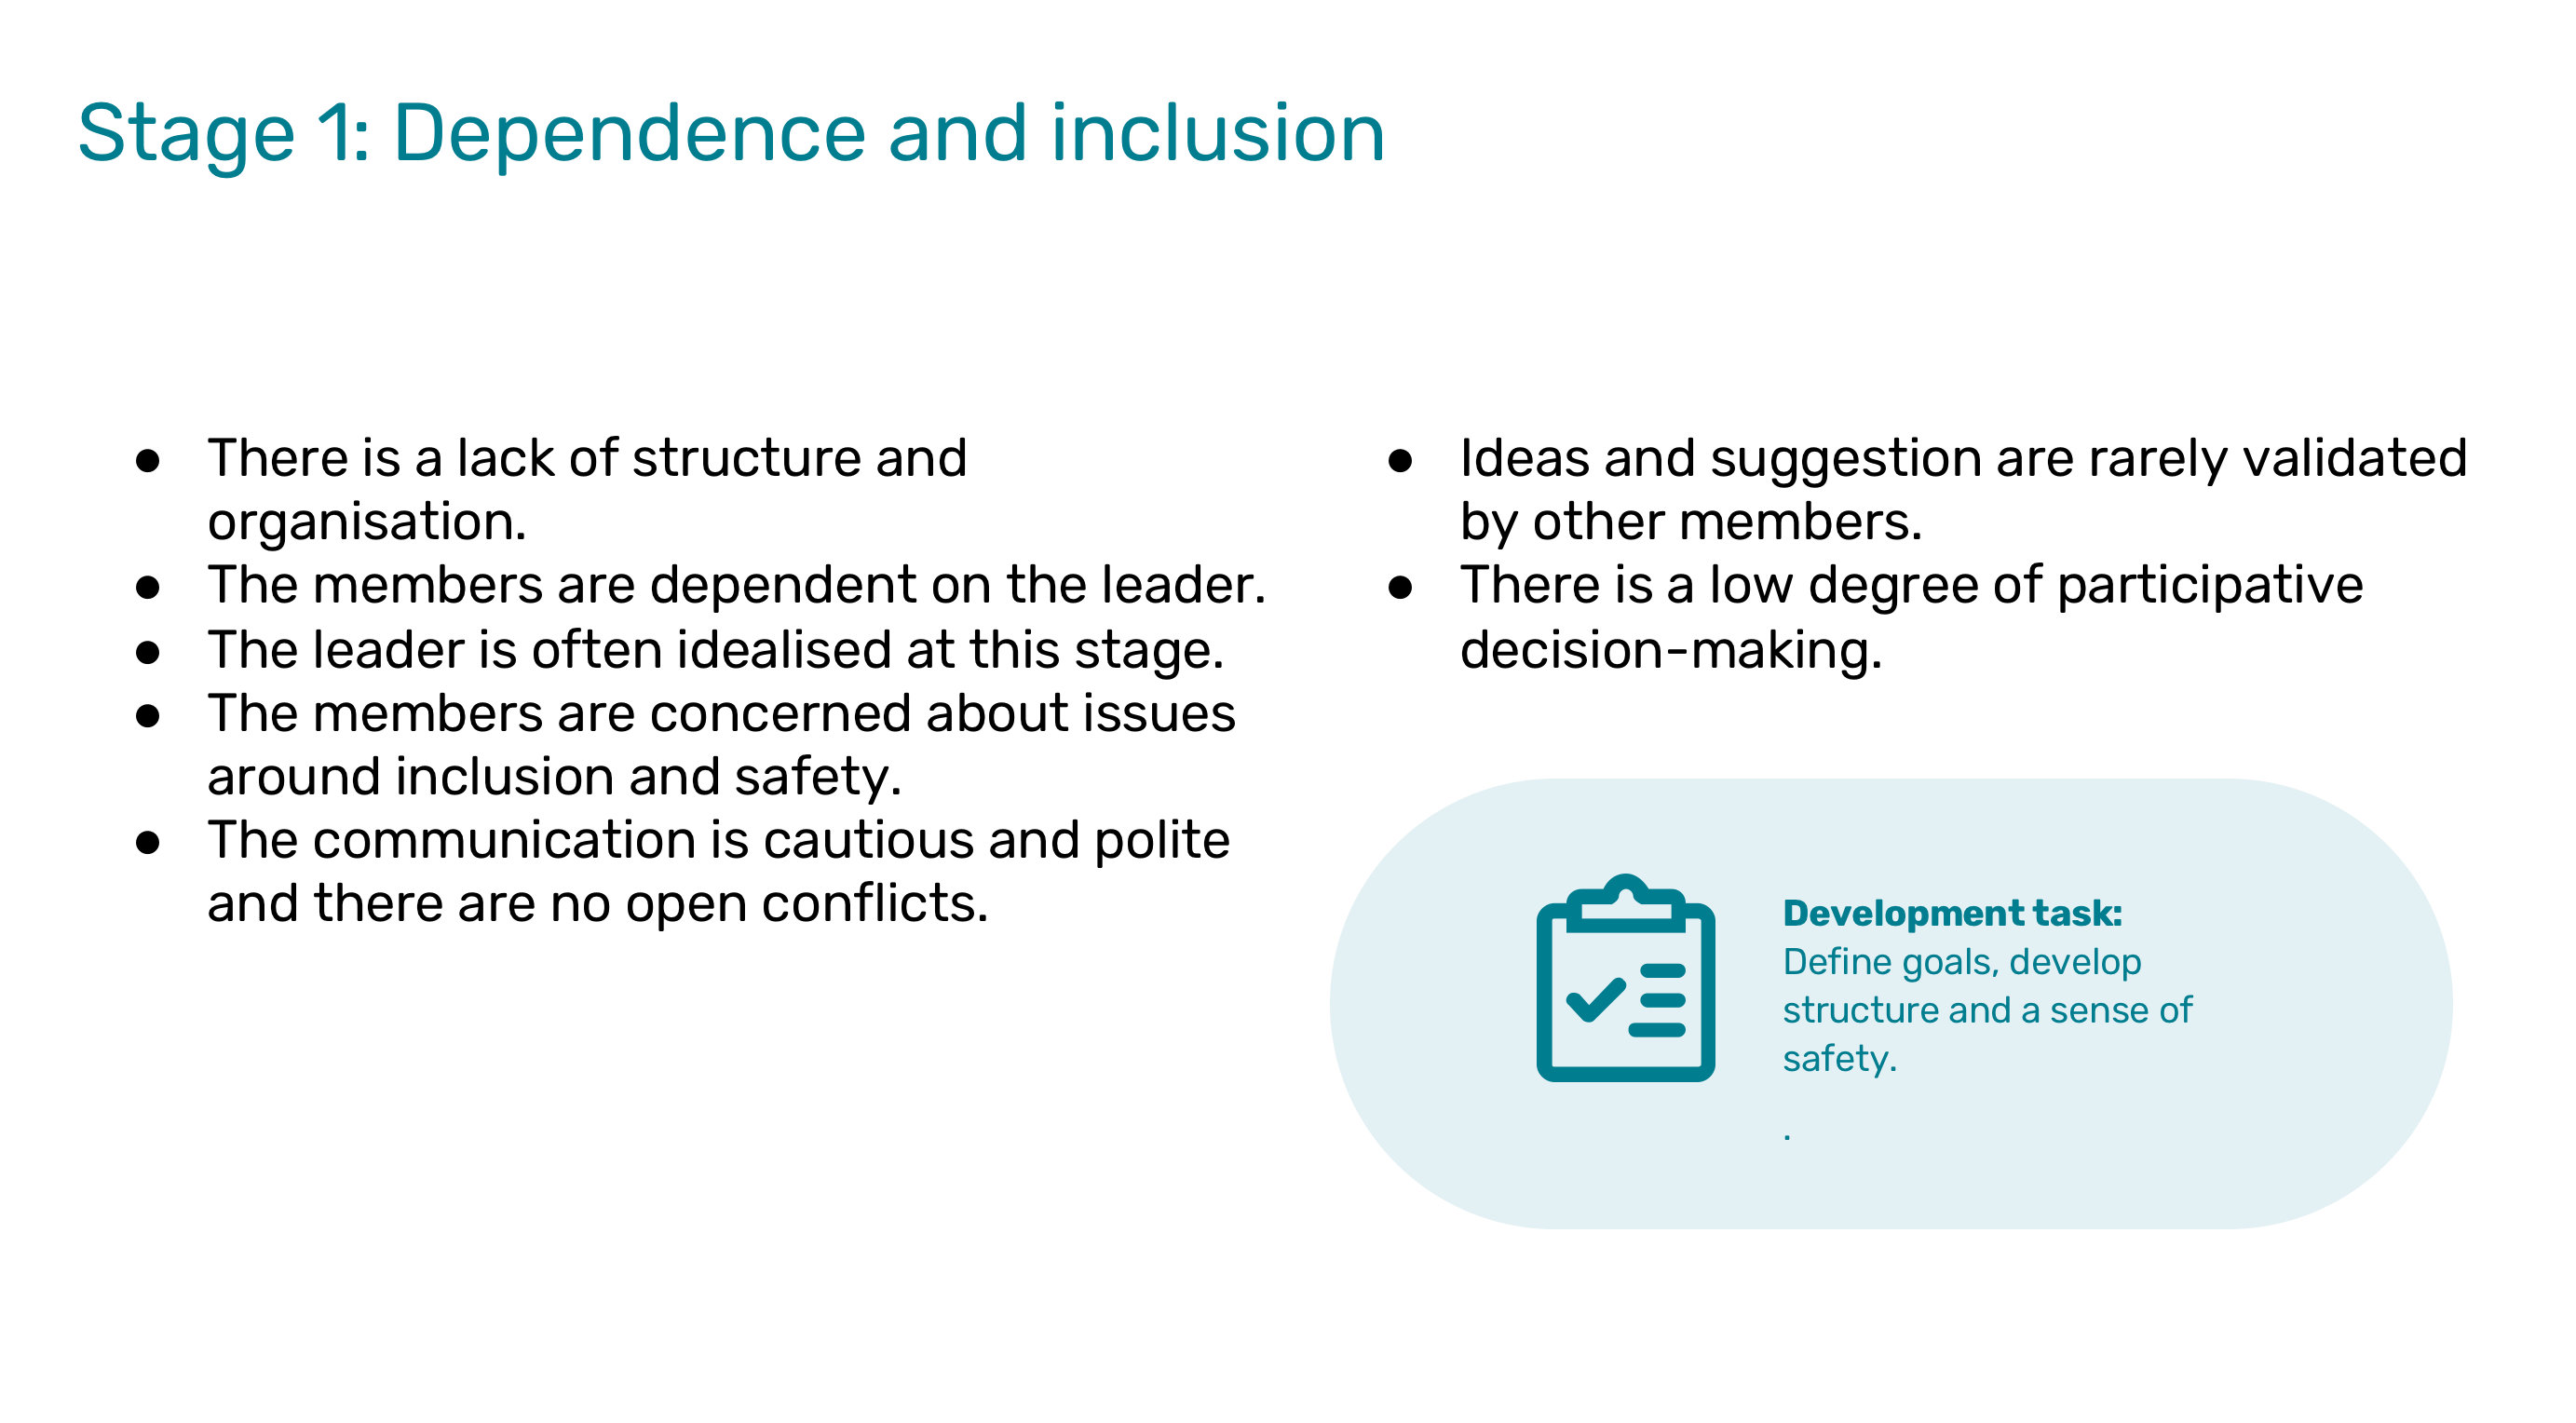
A brief description of IMGD, focusing on its four stages. Average GDQ profiles for each stage and research support for the model and the GDQ.
The team profile
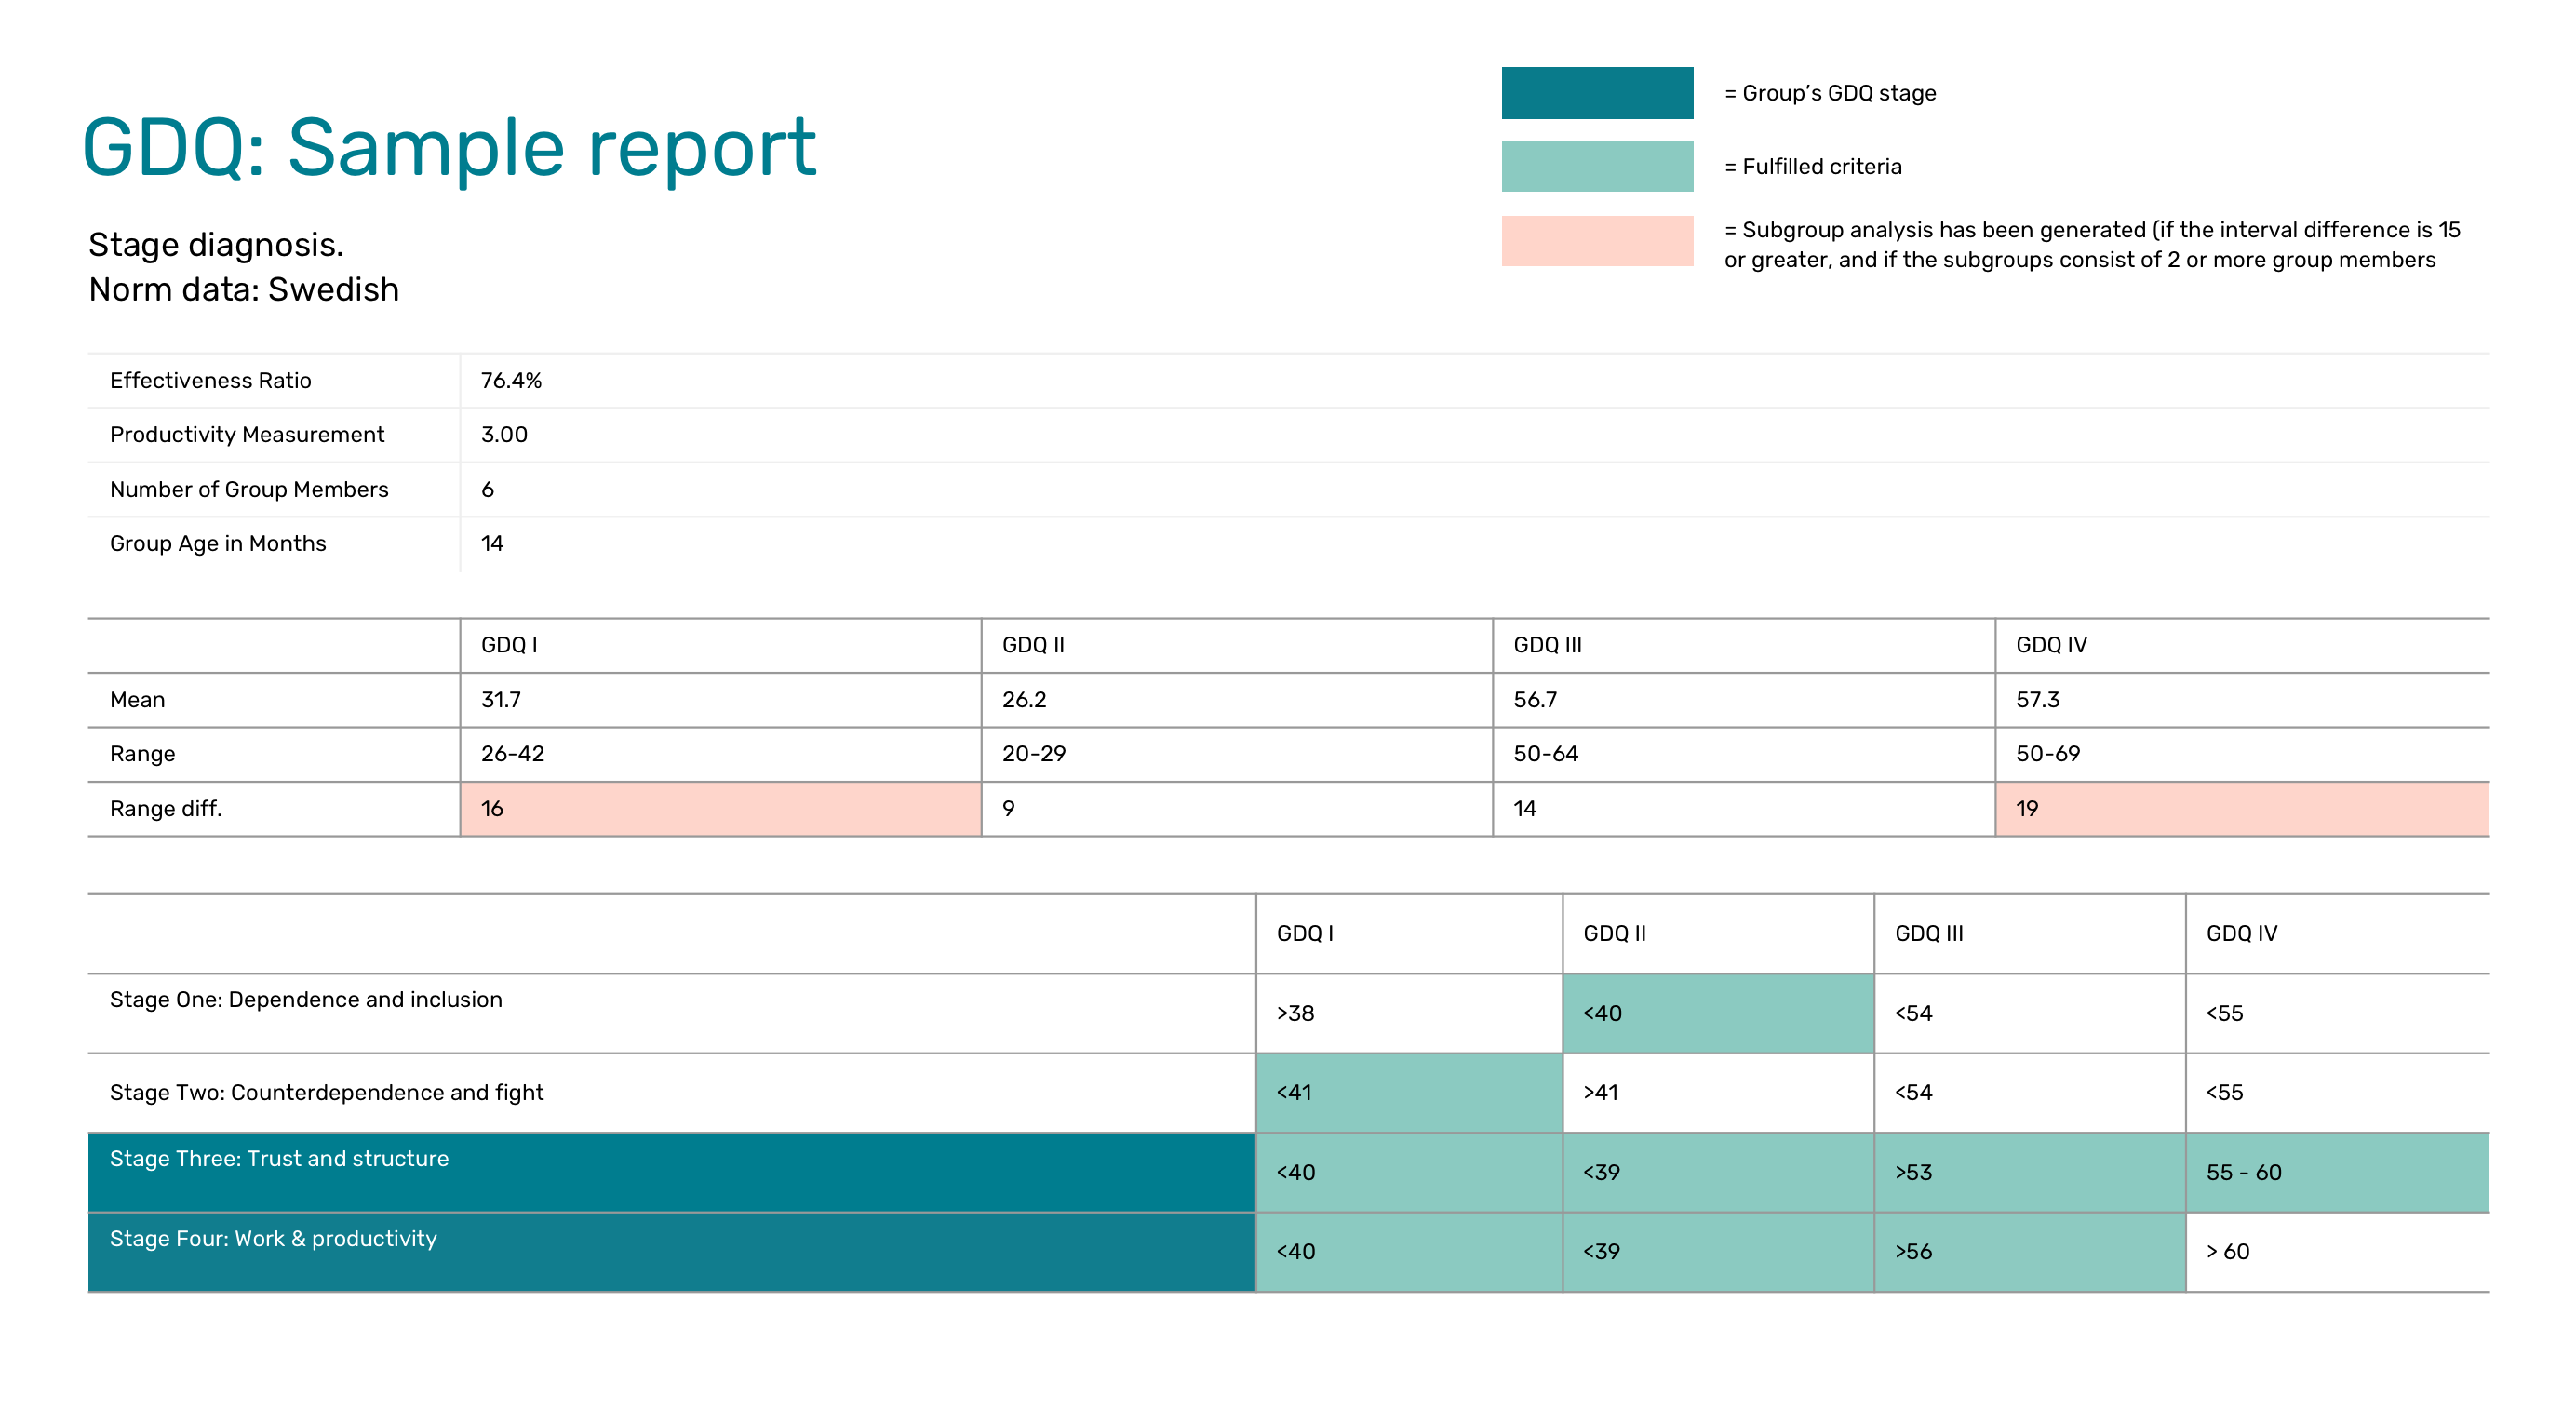
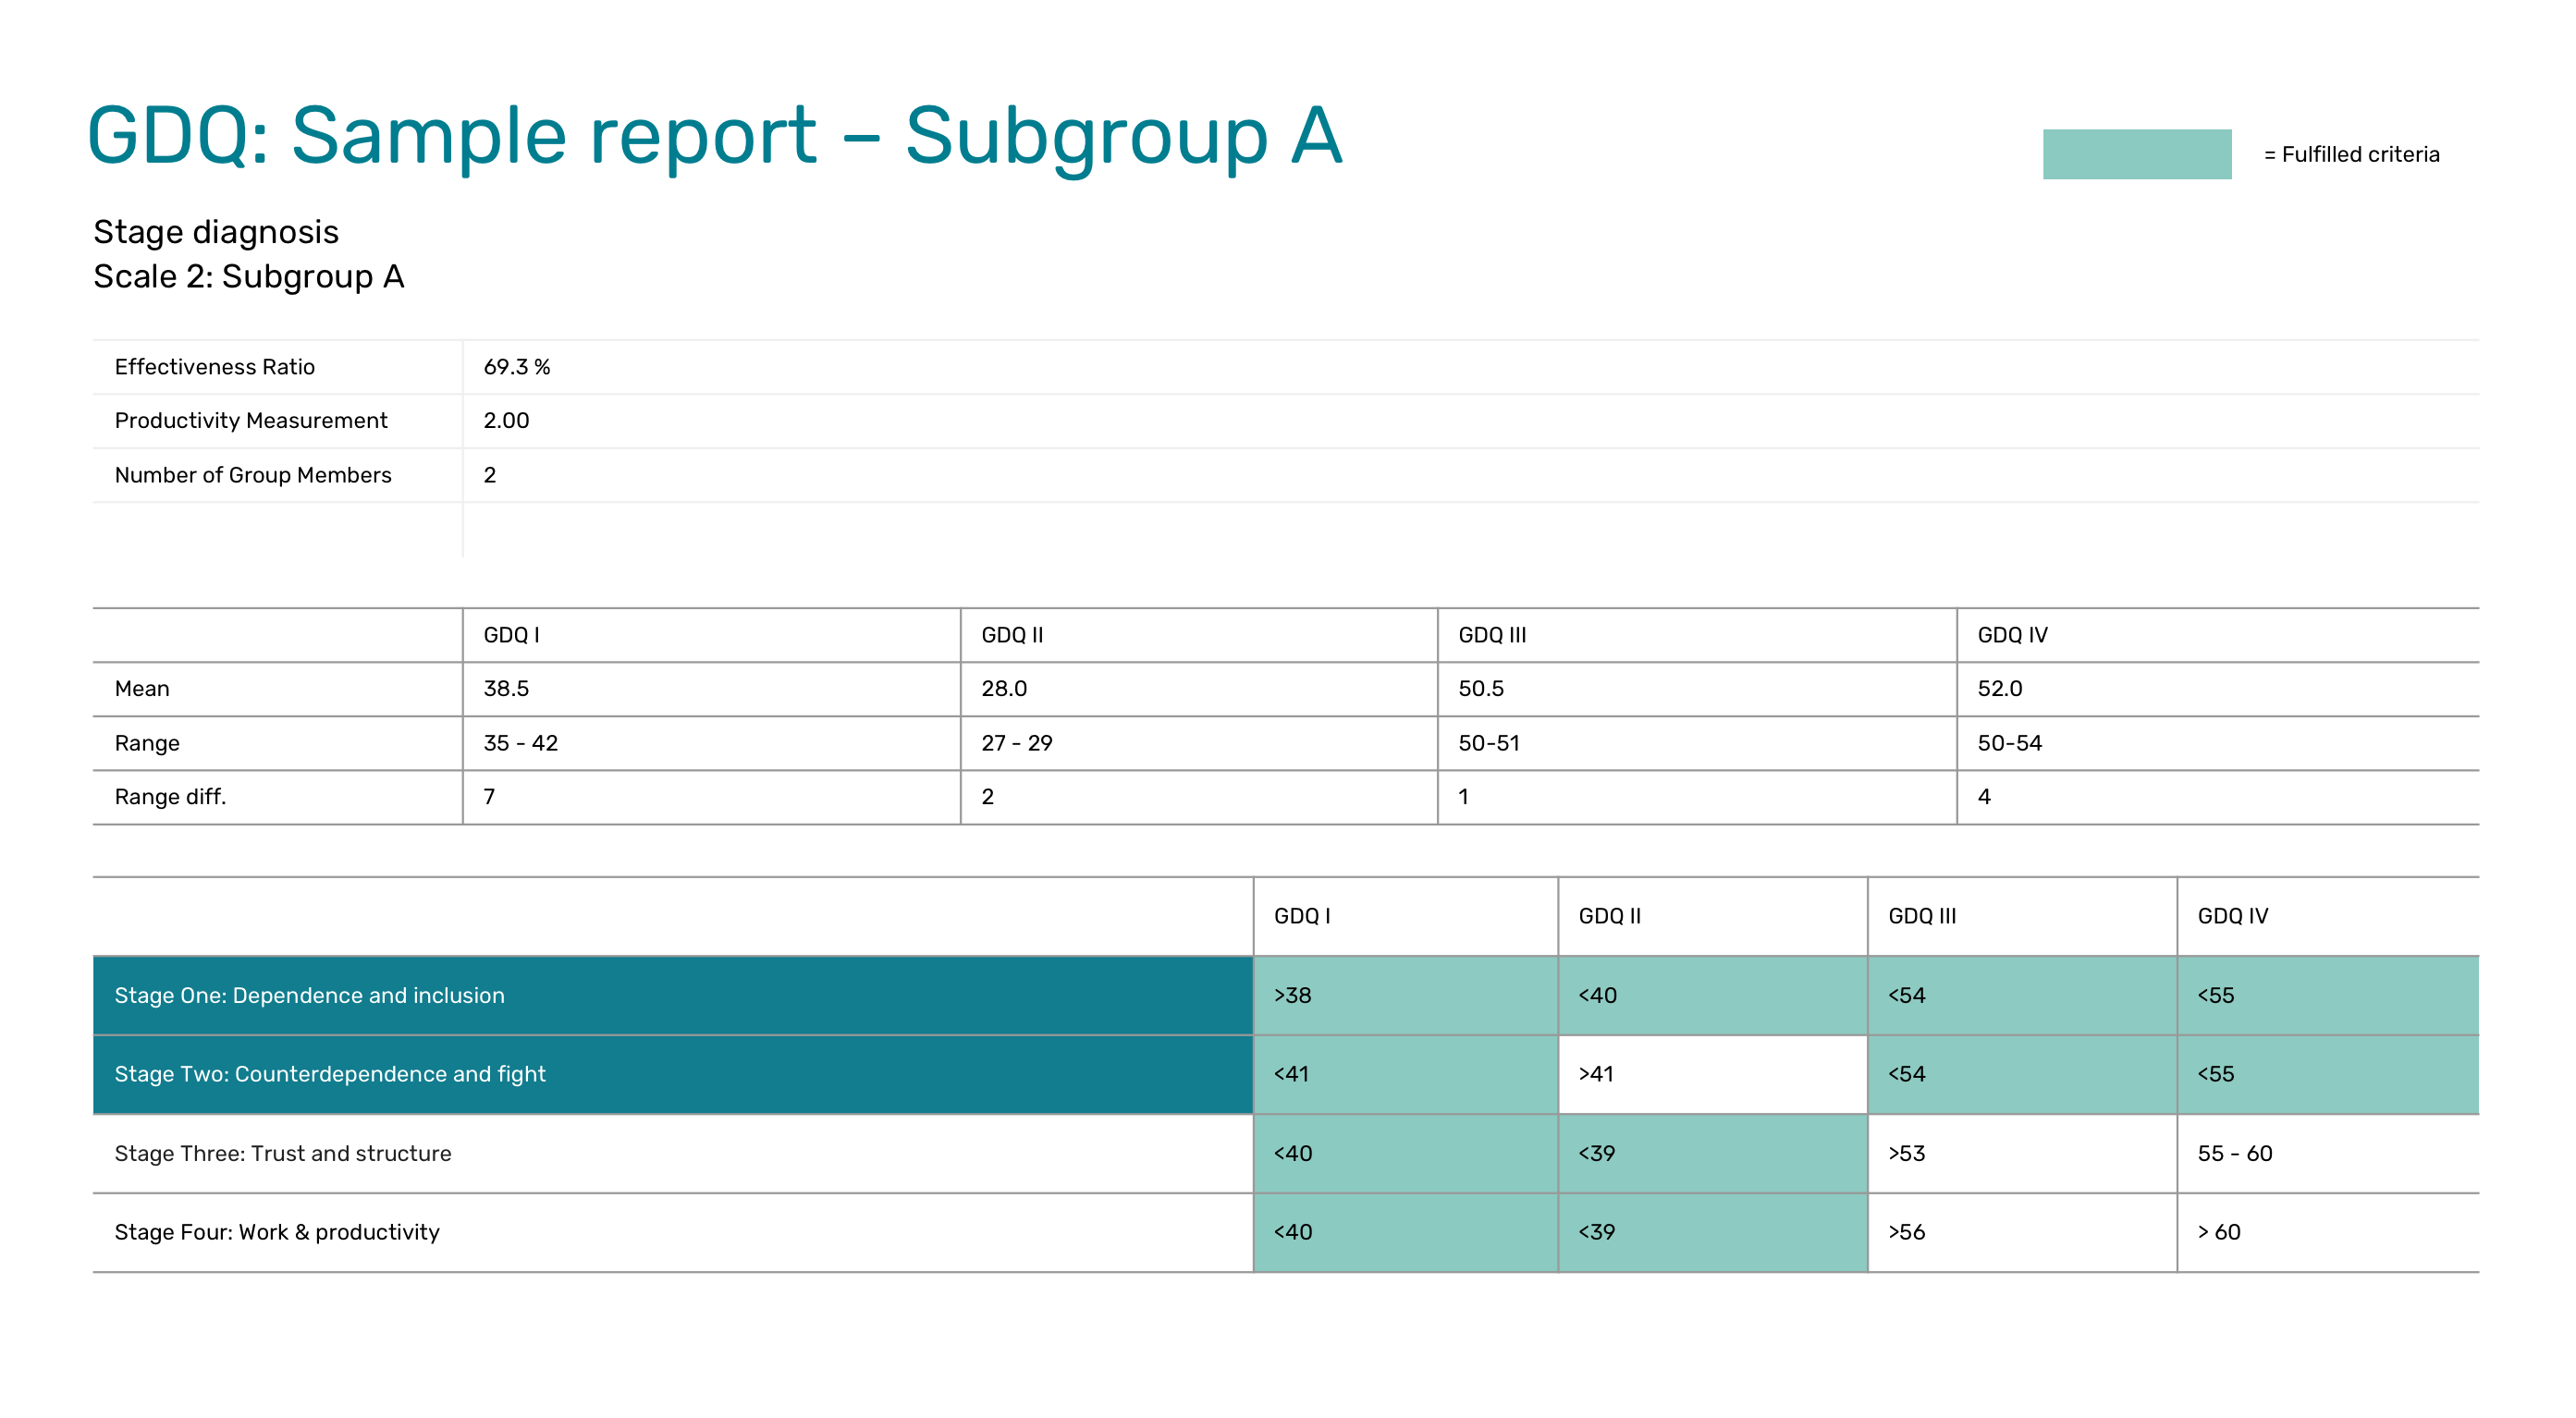
The team profile shows the scores for all four GDQ scales. They can be found on the row labelled “Average”. Each number on the row represents the average of all the members’ scores for the scale. The scores for the various scales are presented in the four columns. Each scale consists of 15 items. The lowest possible score for each scale is 15 and the highest possible score is 75. The range of the various members’ scores is presented below the average score for the scale.
Number of group members shows the number of group members who responded to the questionnaire. The age of the group in months shows how long at least half the members have been in the group. Average is the average score derived from the group members’ responses. Range shows the group members’ highest and lowest scores.
Range difference shows the difference between the group members’ highest and lowest scores.
A red mark in a field indicates that a subgroup analysis has been generated for the corresponding scale. A subgroup analysis has been generated if the range difference is 15 or higher and if the subgroups consist of 2 or more group members.
Stage diagnosis
The stage diagnosis is based on the averages of GDQ I, GDQ II, GDQ III and GDQ IV. If the four averages meet three or four criteria in the table, that suggests the stage that the group is currently at. Green indicates that the criteria have been met. Four out of four possible criteria is a stronger indication of the existing stage compared to three out of four criteria.
Norm data shows the norm values against which the results are presented.
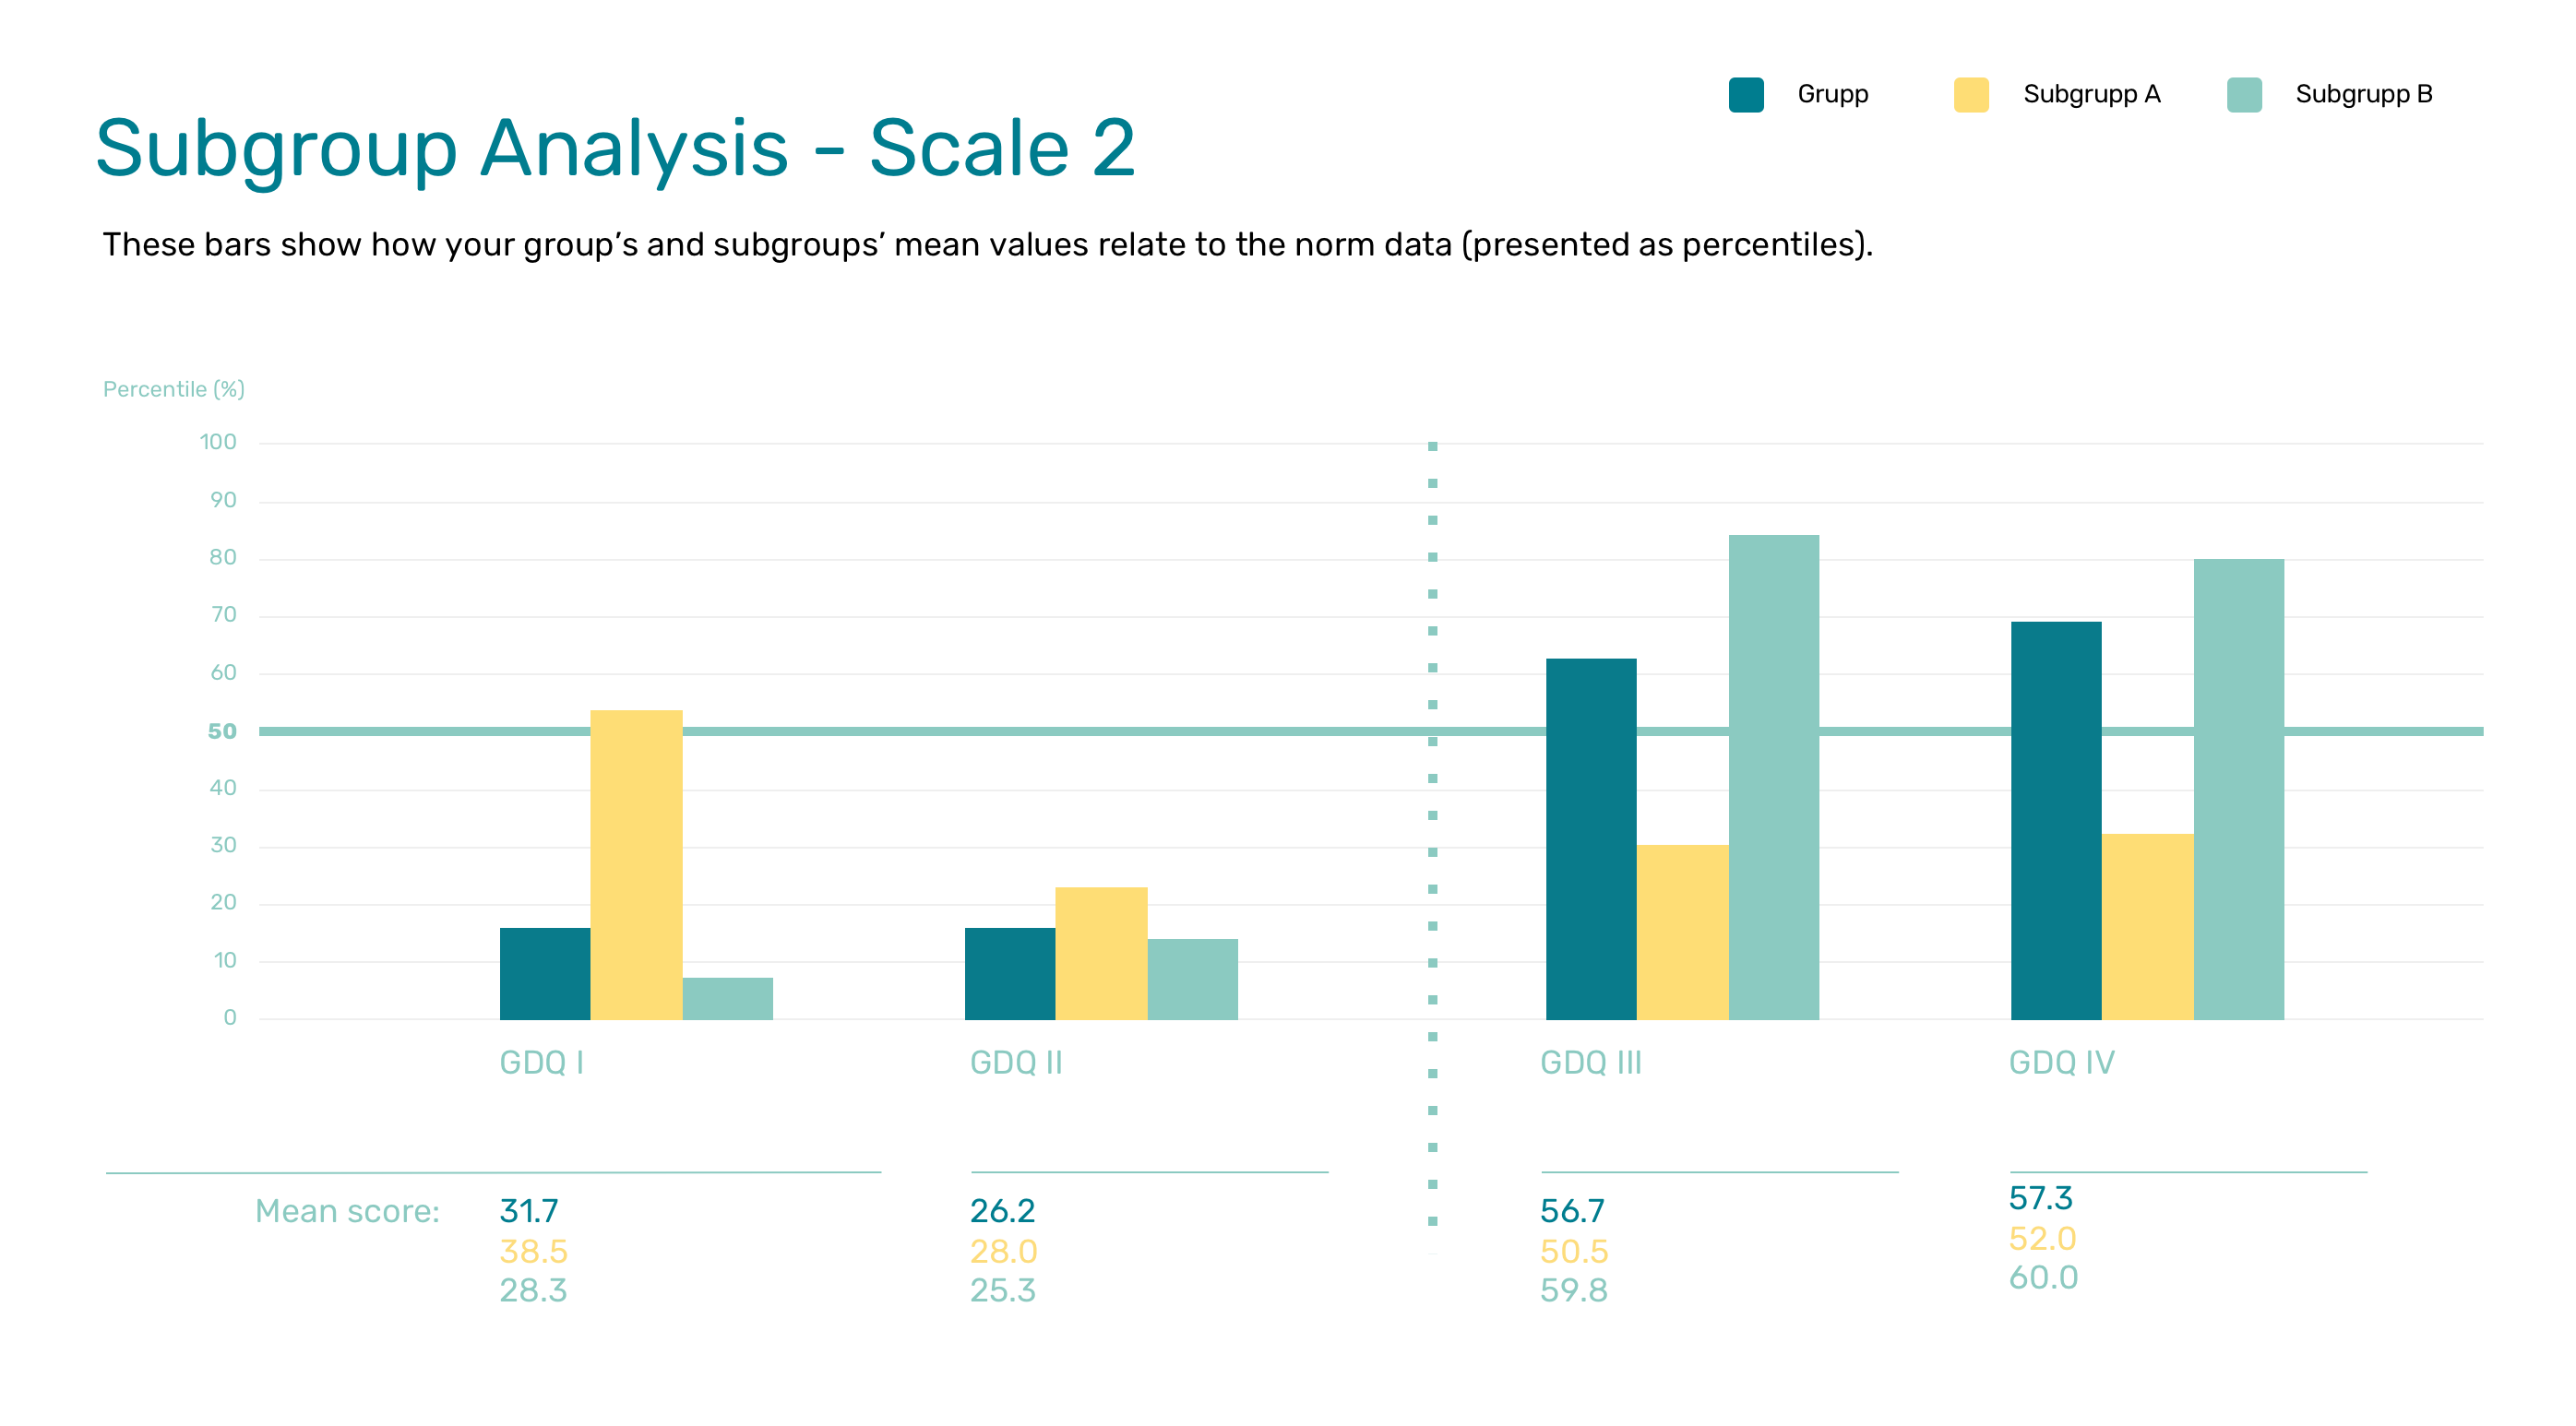
Scale scores in relation to norm data
The bars in this table show the averages for the four GDQ scales compared to norm data percentiles. The norm data is organised in percentiles with 10% of the teams in the norm data representing each step. Each average for a team is thus converted to a score on a standardised 100-point scale with 10-point intervals.
For example, the average of 44.3 for scale 1 corresponds to the 87th percentile, which means that it is an extremely high average. Compared to norm data, 87% of the teams have lower values for scale 1. The 50th percentile means that half the teams have lower and half have higher averages in relation to norm data.
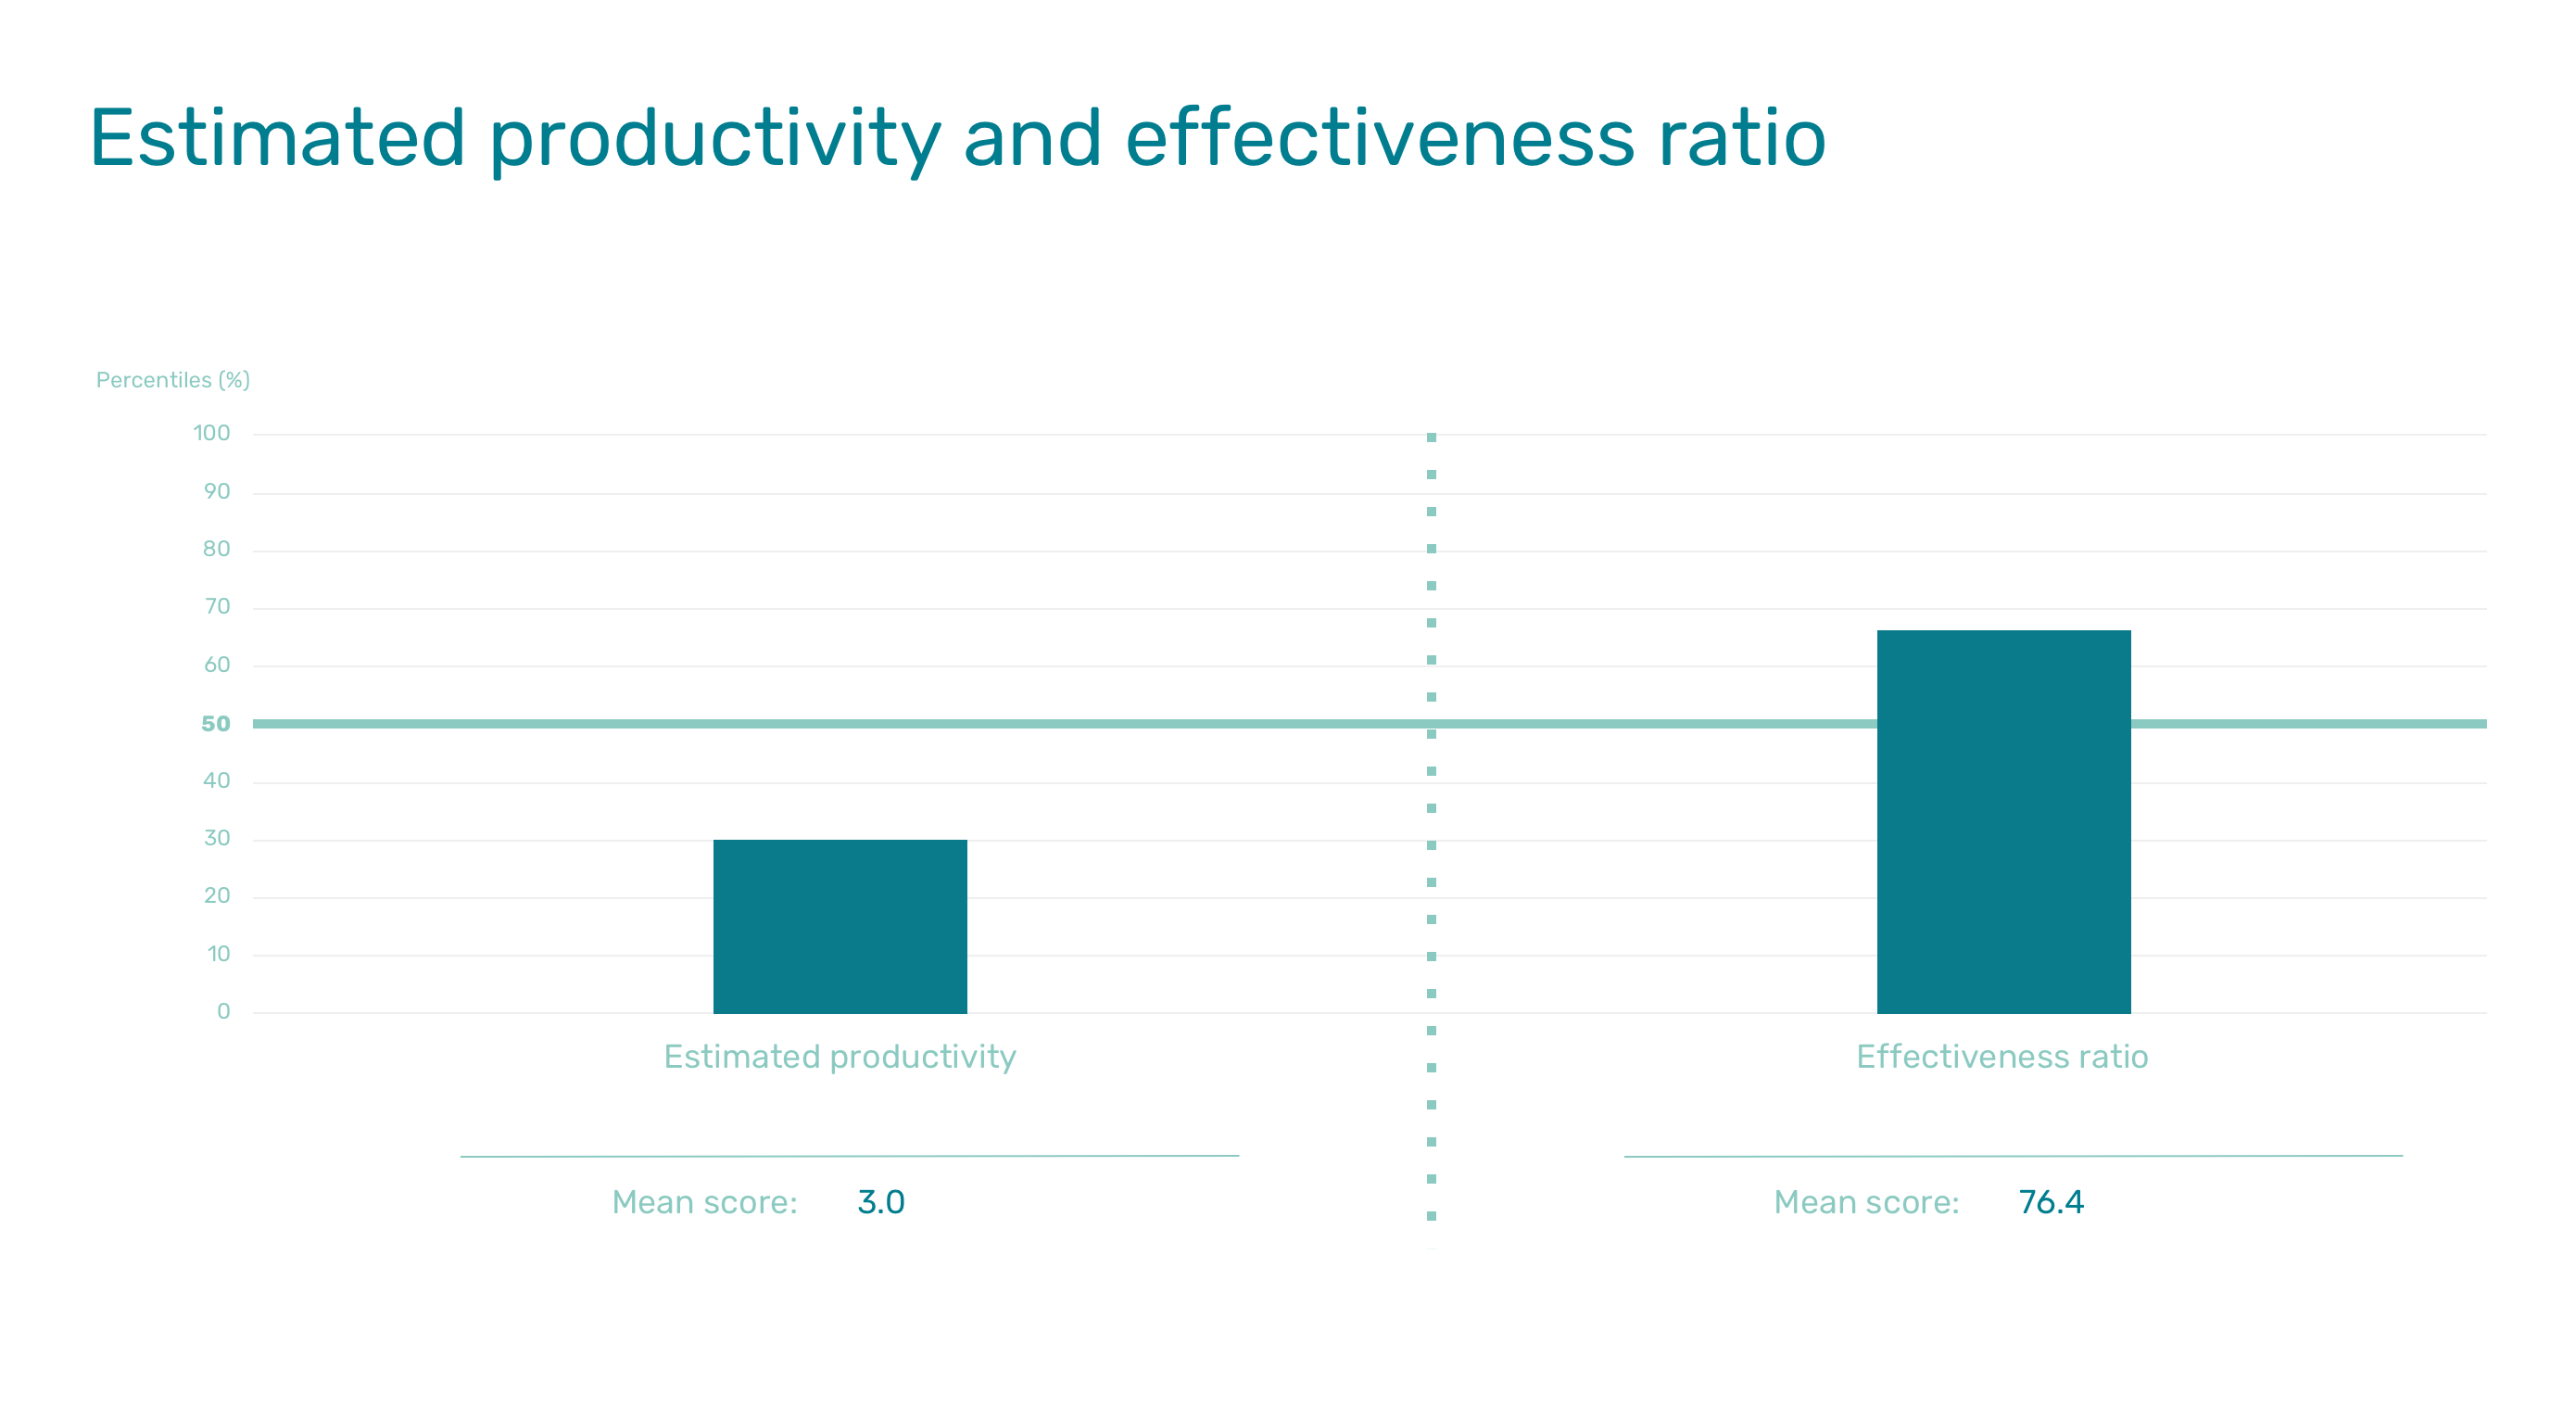
Productivity score and efficiency rate in relation to norm data
Efficiency rate. This rate is based on the group’s score on scale 4. It consists of the scores on scale 4 converted to a percentage by dividing the average by 75 (the maximum possible value on scale 4).
Productivity score. This is the average of the members’ rating for the item “How productive do you think this group is?”, which follows immediately after the demographic questions in the GDQ questionnaire.
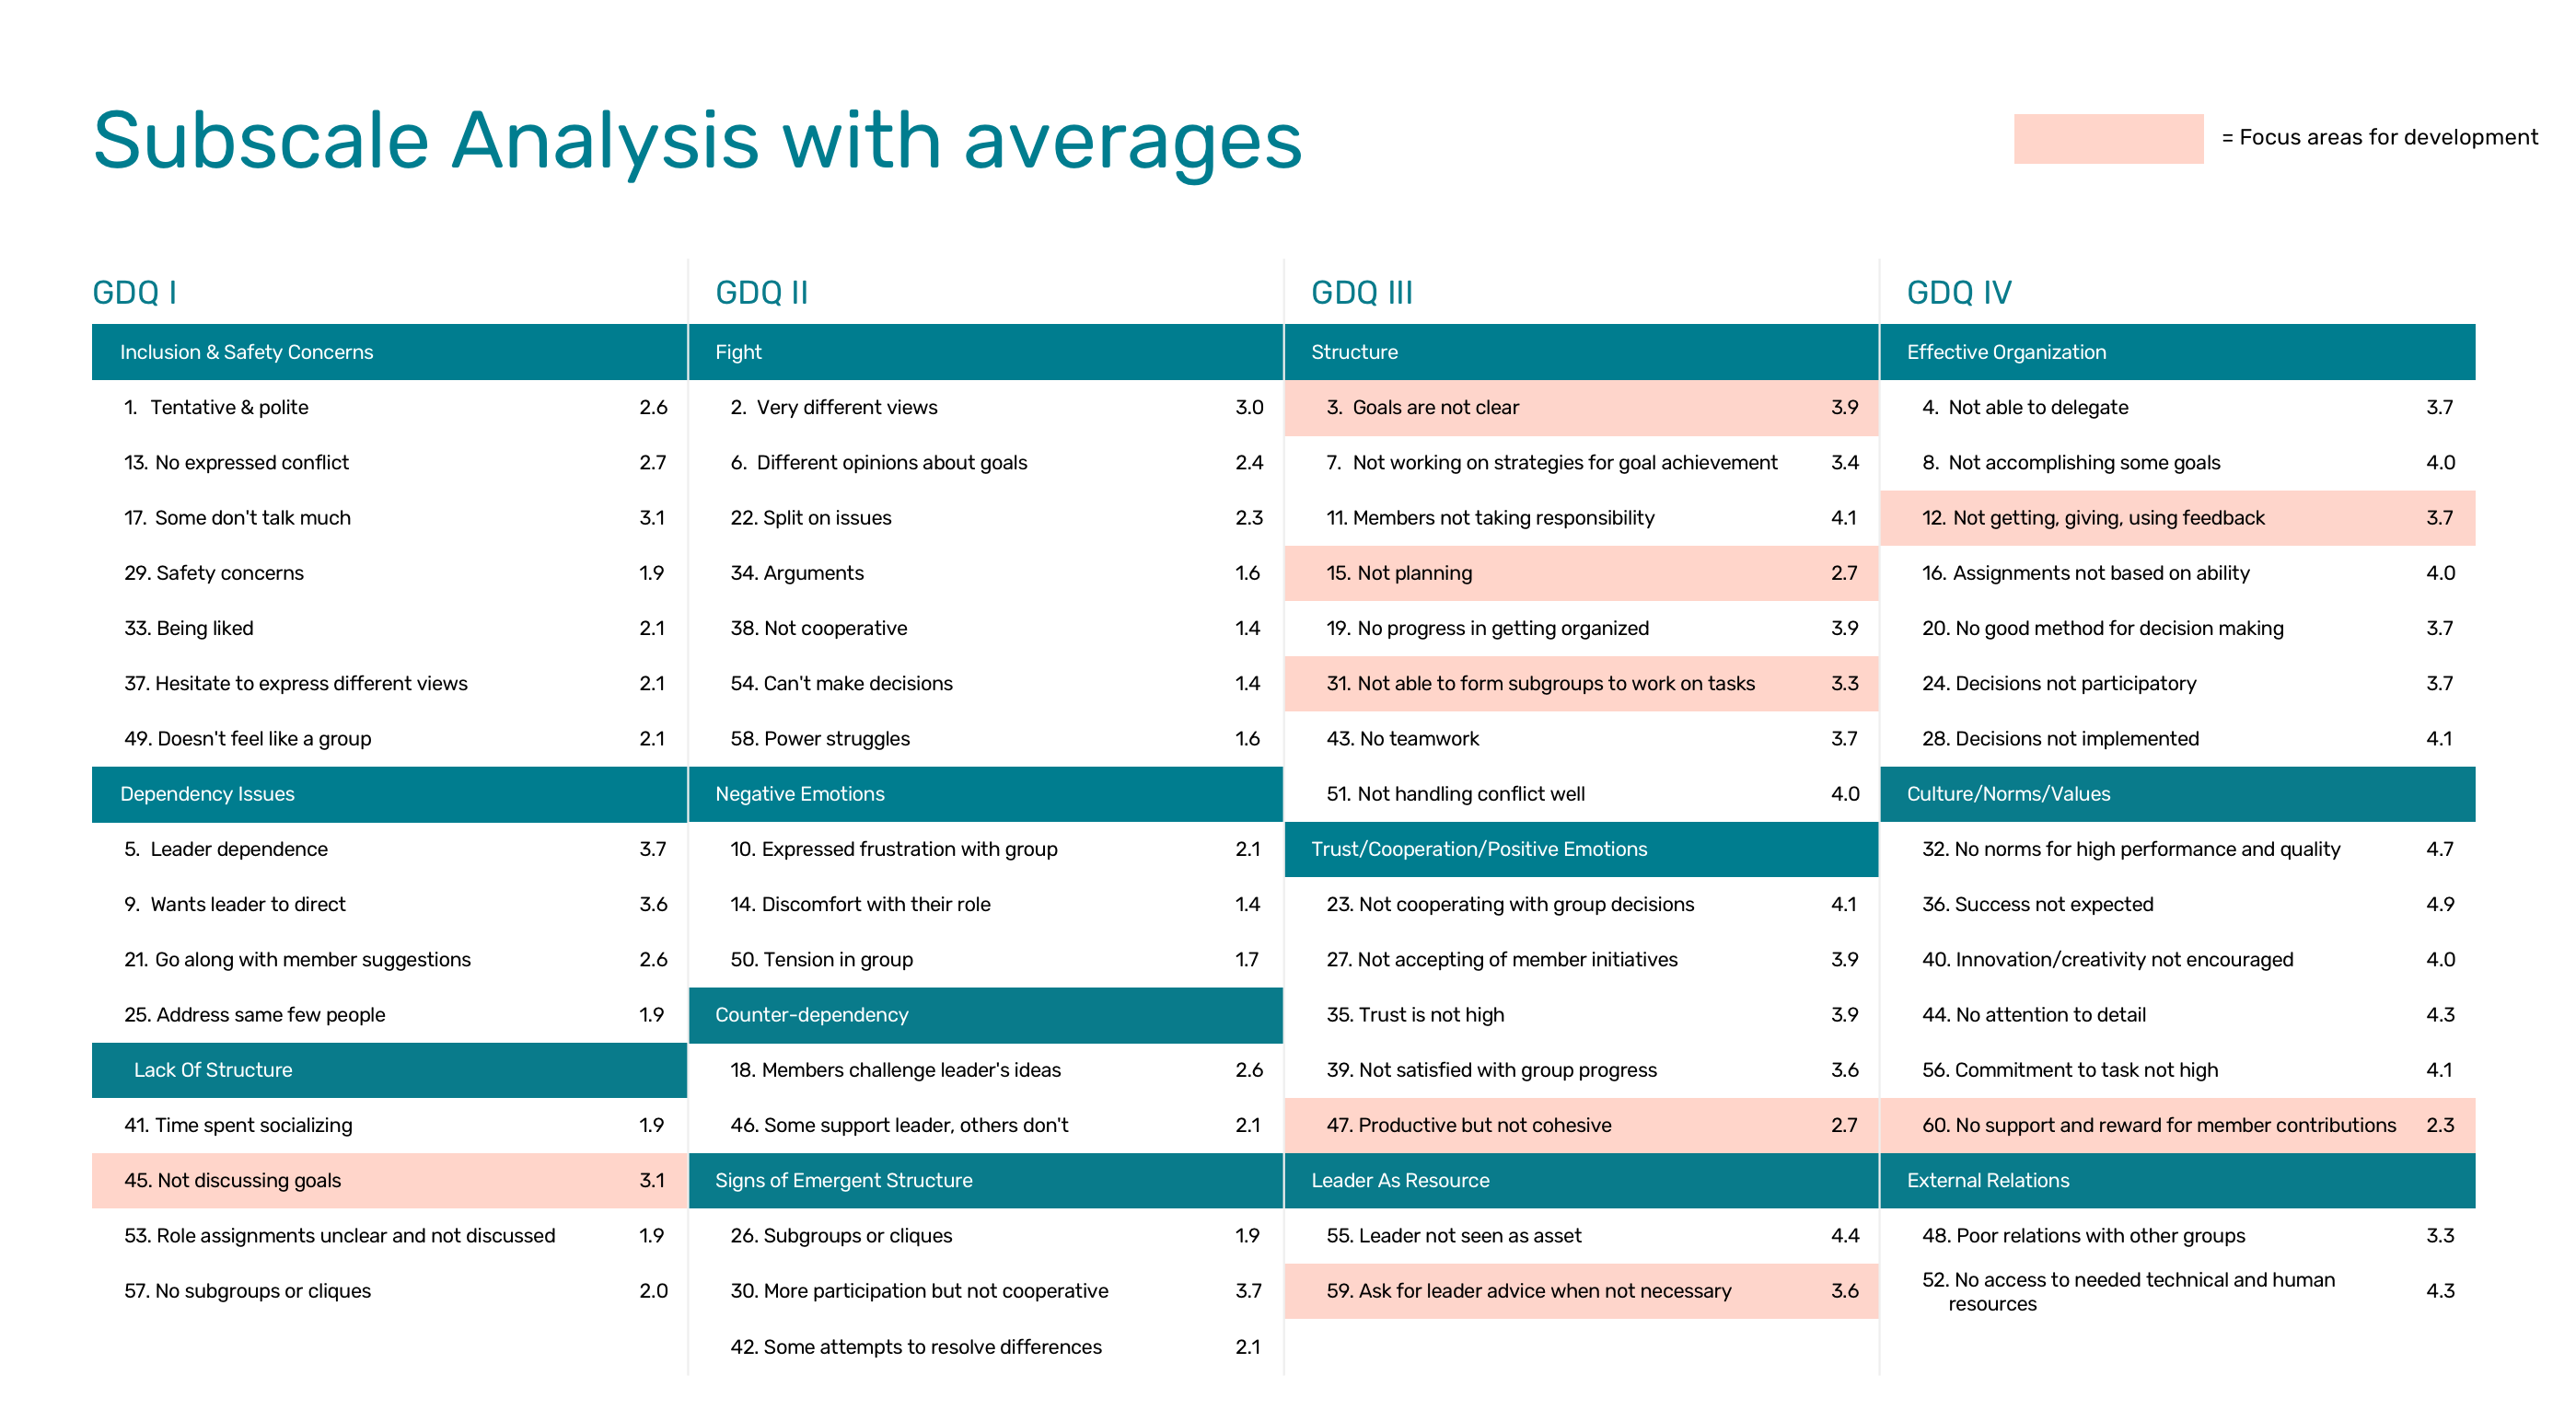
Subscale analysis
The subscale analysis shows which items in the GDQ appear to be more typical of the group, since more members have given them either a high or a low rating. If a majority of the group members has given items on scales I and II a high rating (3-5) and items on scales III and IV a low rating (1-3), these items will be marked in colour in the subscale analysis.
Note that items on scales III and IV have been converted to their opposites compared to the questionnaire. The first item on scale III in the subscale analysis “The objectives are unclear” is a modification of the item “The objectives are clear”. This is because a response between 1-3 indicates a lack of clear objectives.
The goal of the subscale analysis is to identify items that merit more attention from the team. High scores on scales I and II indicate that the team is still engaged in inclusion, dependency, counterdependency and/or fight behaviour that can get in the way of development. Low scores on scales III and IV indicate a lack of trust, structure, work and/or productivity behaviour which, if addressed, would lead to development and efficiency. The subscale analysis is a source of information on what the team may need to change or start doing differently to become more efficient.
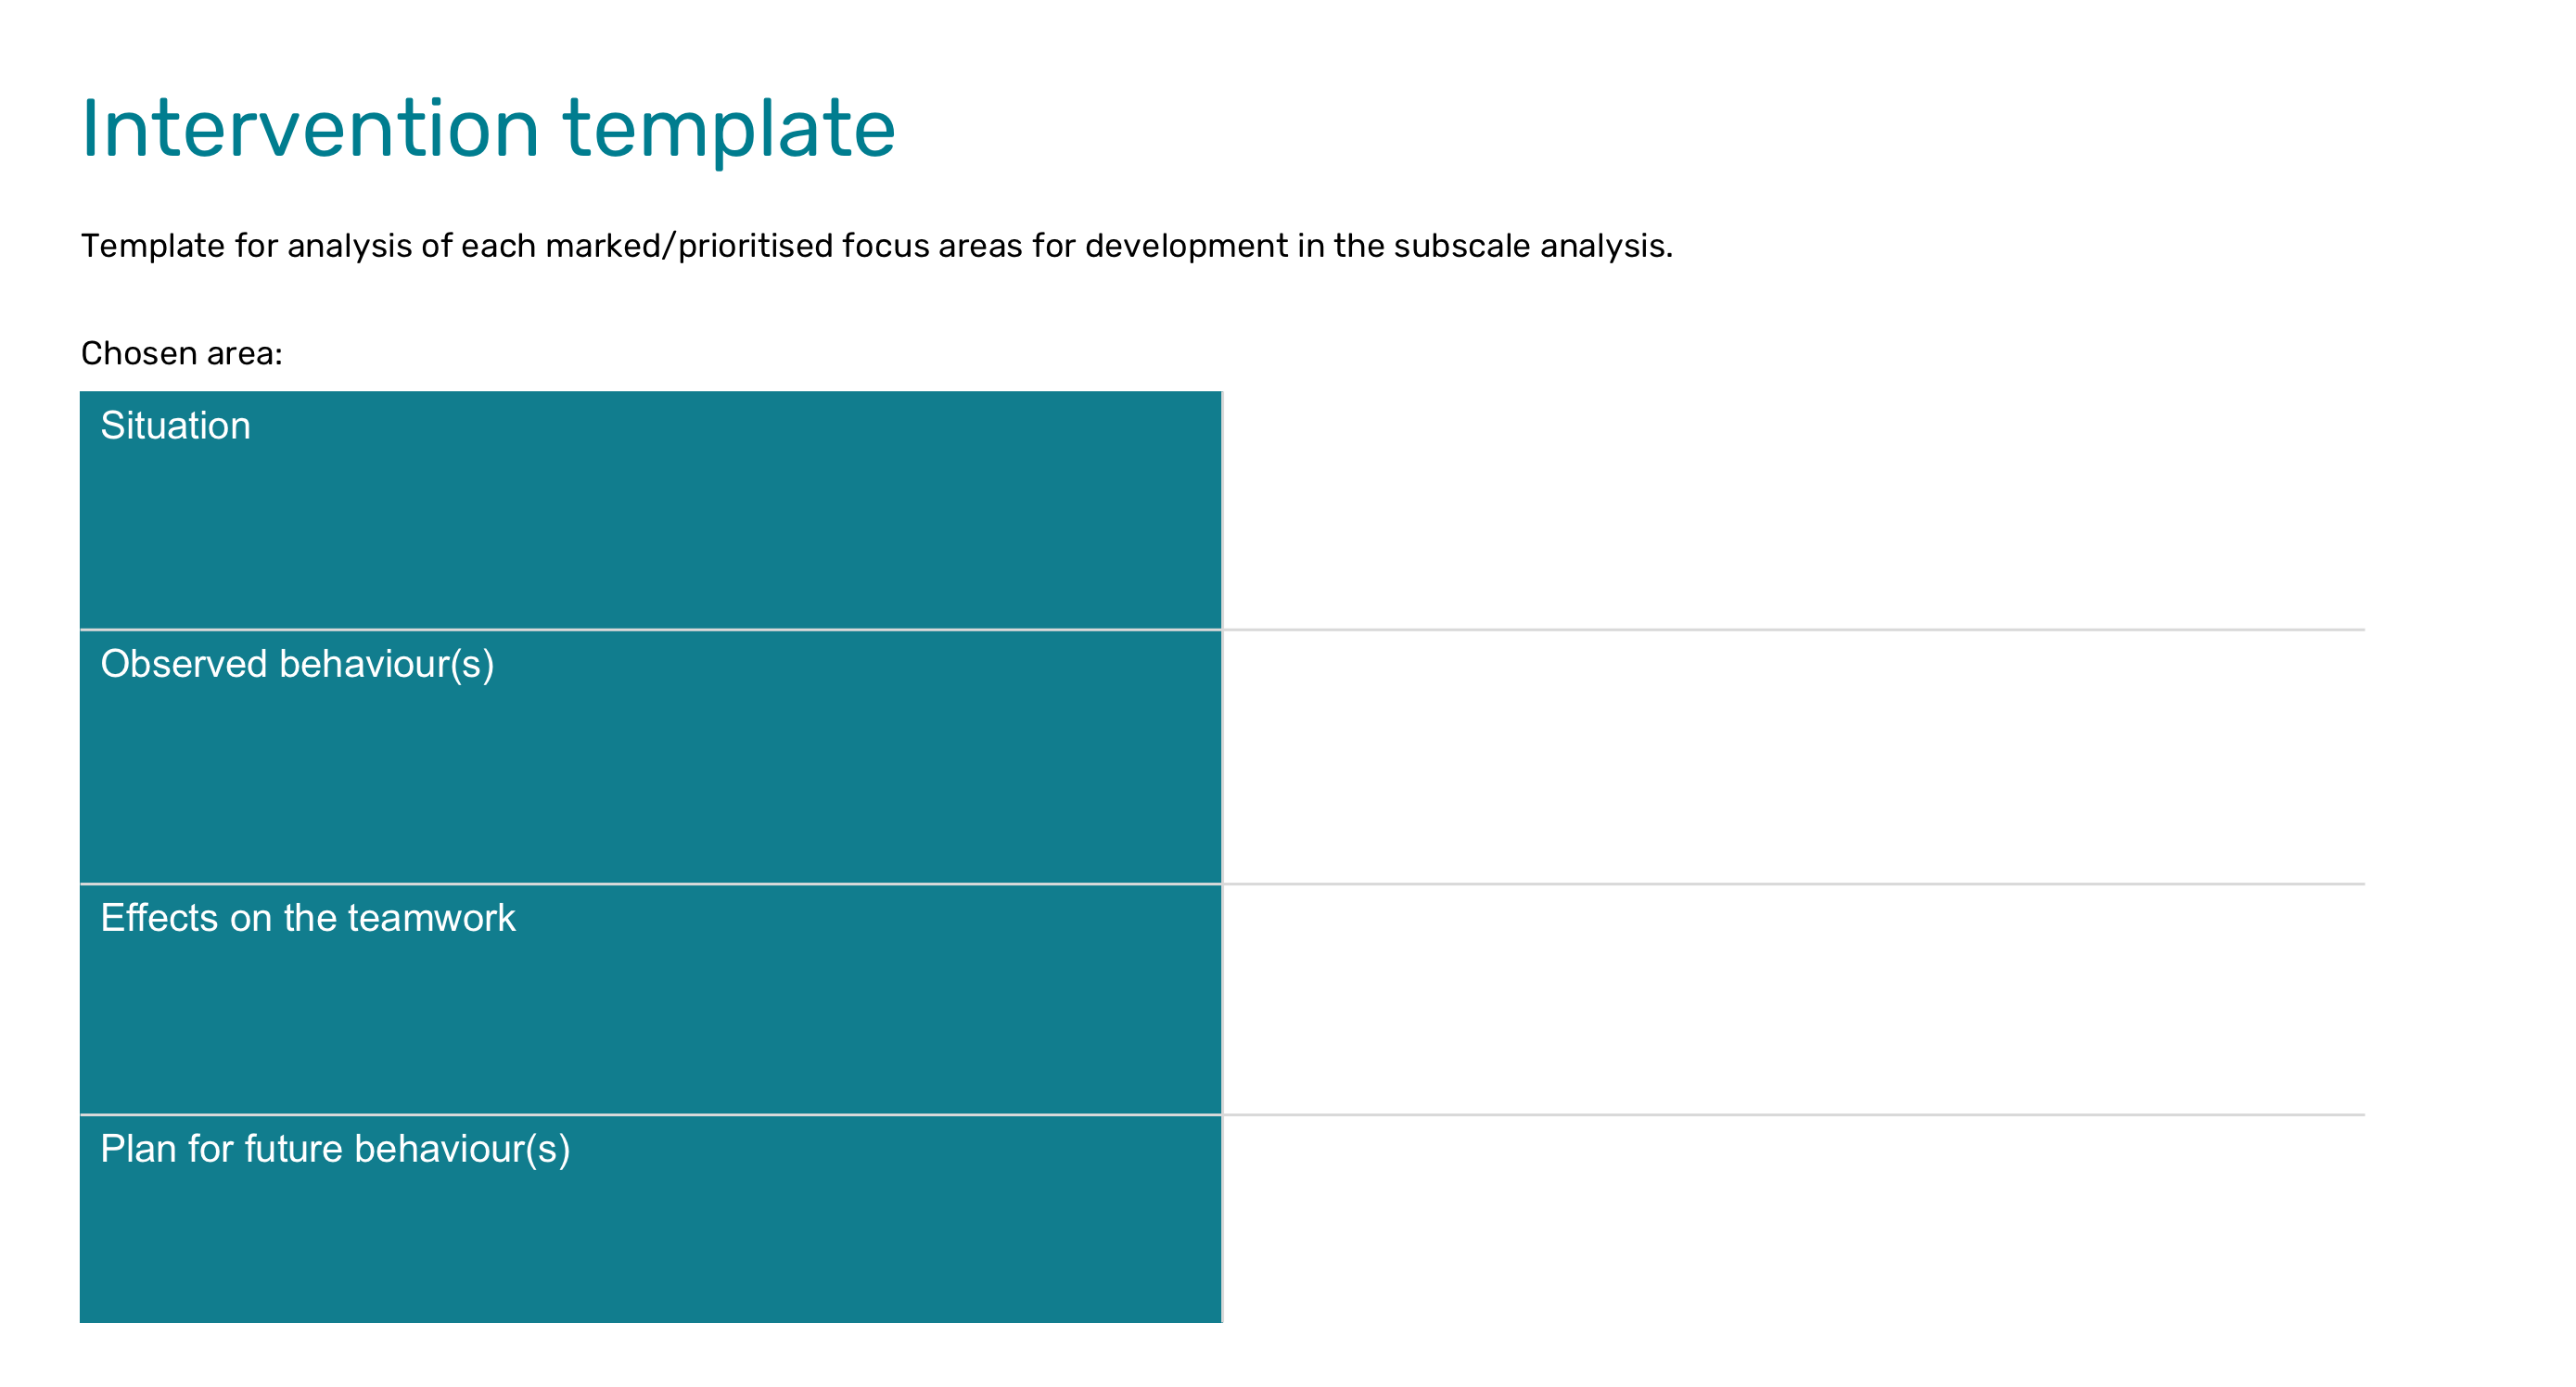
Subscale analysis with the averages and an intervention template
You can also choose to prioritise between items marked with a colour. Use the averages in the subscale analysis to prioritise. You can identify marked items that have high averages (e.g. above 3.5) for scales I and II, and marked items that have low averages (e.g. below 2.5) for scales III and IV. This enables you to focus on a few critical areas of behaviour and helps the team to focus on them, particularly if they have a large number of items marked.
All marked focus areas are presented in a separate slide in the form of a compilation split between each scale.
When the focus areas have been identified, the next step is to work with the team to identify which specific behaviour is associated with each focus area marked with a colour and how that behaviour can be modified. There is an intervention template for this which can be used as a starting point for a behavioural analysis of that kind. These behavioural focus areas should be seen in context, i.e. the team’s stage of development. Goals for behavioural changes should be formulated taking into account the team’s capacity in relation to its existing stage of development.
Subgroup analysis
A big difference between team members with regard to how they rate items on one or more of the scales may be an indication that there are subgroups in the team with differing views on the development and efficiency of the team. The next slide presents information on whether such subgroups exist and how their views differ. Remember that these subgroups are only based on how the members have rated the various scales.
The subgroups have been identified by selecting a scale with a spread size of 15 or higher. This spread size was then divided by 2 to establish a limit value that divides the team into two subgroups. For example, if the lowest scale value is 24 and the highest is 46, the spread size will be 22. Half of 22 is 11. The limit value is then 35 (24+11 and 46-11). Members who have given a rating of below 35 on the scale make up one subgroup and members who have given a rating of above 35 on the scale make up the other subgroup.
Results for all scales, including the productivity score and efficiency rate, have been calculated for each subgroup to show each subgroup’s view of the development stage, productivity and efficiency of the whole team. No subgroup analysis is carried out when one of the subgroups consists of only one person, a so-called outlier.
Strengths, weaknesses and proposals for development
This is a presentation of the members’ responses to the open questions in the questionnaire. As with the focus areas identified, the information in these responses should be analysed in context, in other words the stage of development of the group.
Key factors
The GDQ report is surrounded by a seamless process that includes collecting data via a research-based questionnaire as well as tools to help you keep track of and manage development and communication with your group. Some of the key factors available for the report and peripheral tools are listed below.
Manage your groups and surveys from a cohesive platform – My GDQ Management.
Schedule your mailings and keep track of developments by activating reminders.
Choose to send out the questionnaire and generate the GDQ report in different languages.
Choose to compare your group’s results against Swedish, American or global norm values.